Page 1
LILAC Document Help
LILAC Reporting Analytics
LILAC Analytics presents data in table or graph format, to be used for the discovery, interpretation, and communication of meaningful patterns.
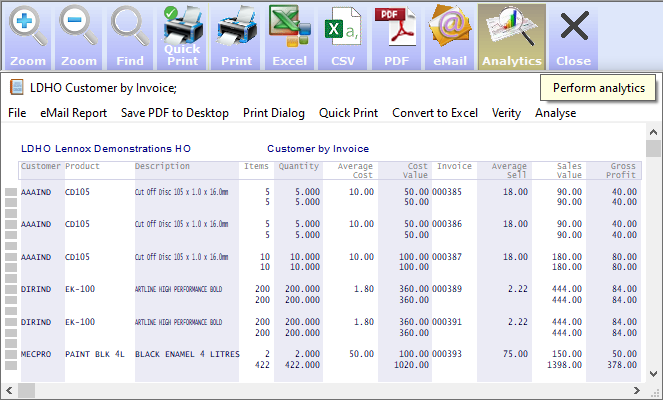
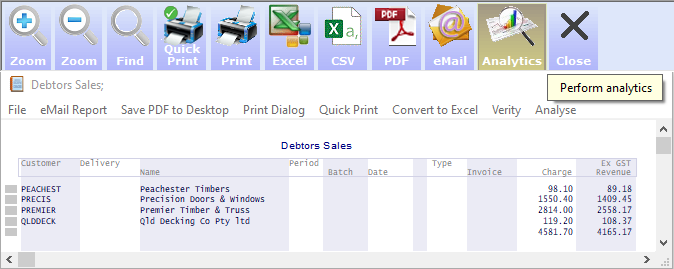
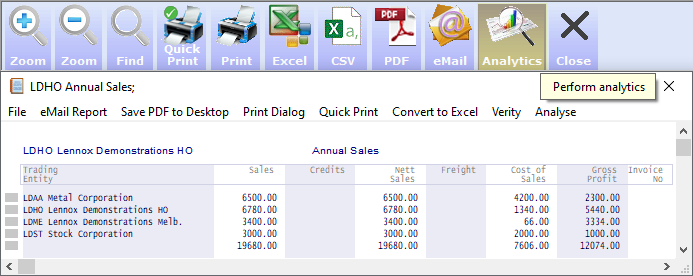
LILAC Analystics is accessable from all reports via the Analytics button highlighted below.
1. Sort Up
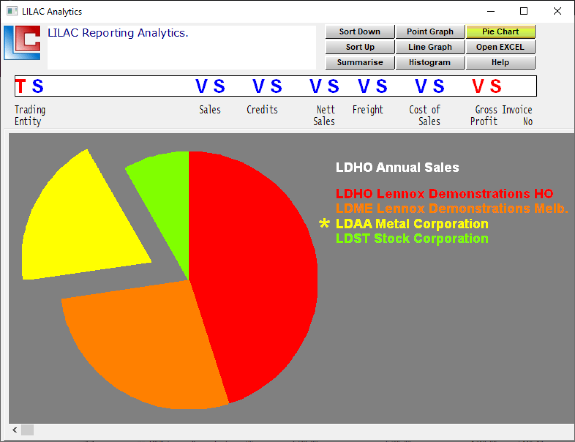
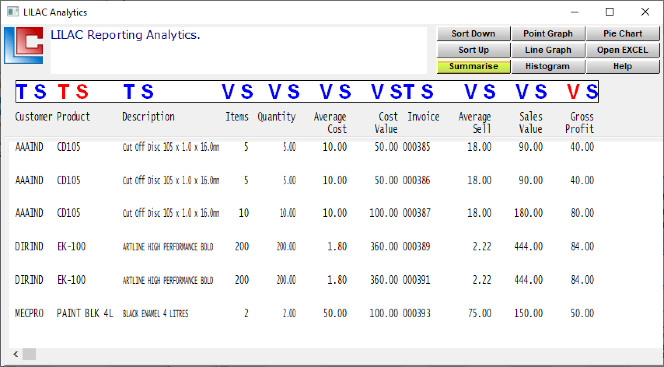
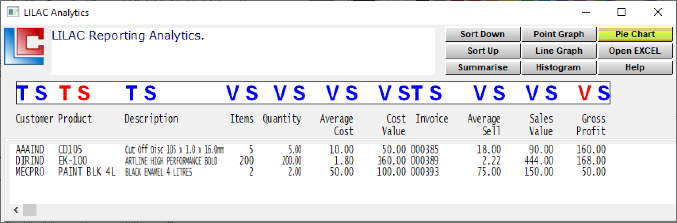
The LILAC Analytics window allows data to be arranged and re-presented.
Trading Entity is selected as the Title (T)
Gross Profit is selected as the Value (V)
Gross Profit is also selected as Sort Criteria (S). Sort up show the highest value first.
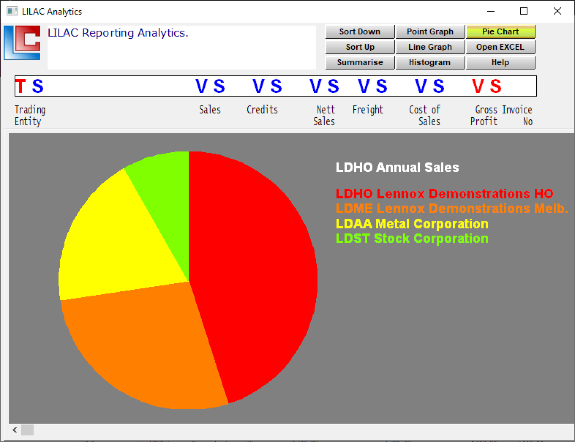
Trading Entity is selected as the Title (T)
Gross Profit is selected as the Value (V)
Gross Profit is also selected as Sort Criteria (S). Sort up show the highest value first.
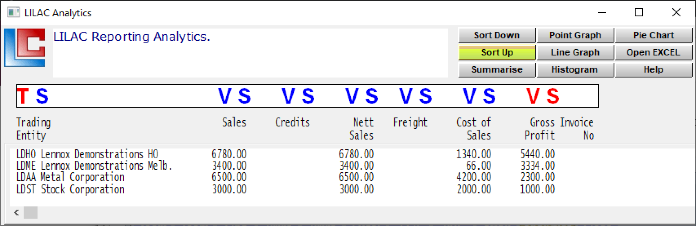
T = Title
S = Sort
V = Value
S = Sort
V = Value
Example Above
T = Trading Entity
S = Gross Profit
V = Gross Profit
Sort Up = Largest Value Shown First
S = Gross Profit
V = Gross Profit
Sort Up = Largest Value Shown First